Seit einiger Zeit erreichen die BaFin vermehrt Anfragen, ob Token oder virtuelle Währungen (einheitlich als „Token“ bezeichnet), die bei Initial Coin Offerings (ICOs) an Anleger vertrieben werden, als Finanzinstrumente anzusehen sind.
Sie hat nun ein Hinweisschreiben veröffentlicht, in dem sie zur regulatorischen Einordnung von Token im Bereich der Wertpapieraufsicht Stellung nimmt. Dieses betrifft alle Marktteilnehmer, die Dienstleistungen in Bezug auf Token erbringen, mit diesen handeln oder Token öffentlich anbieten.
Um etwaige gesetzliche Anforderungen lückenlos zu erfüllen, sind diese Marktteilnehmer gehalten, genau zu prüfen, ob ein reguliertes Instrument vorliegt, beispielsweise ein Finanzinstrument oder ein Wertpapier. Im Zweifel sollten sie die zuständigen Fachreferate der BaFin frühzeitig kontaktieren.
DISCLAIMER: This is not an investment advice or strategy; only an introductory material. If interested in using CDP, you should read more detailed materials involving more detailed descriptions of the liquidation process, fees, etc. Also, always do the math yourself and check your results. Do not trust the provided formulas if you have not checked they apply to your situation. Make sure you understand what you are doing. Be cautious and stay safe.
What is a CDP?
CDP is a Collateralized Debt Position, a smart contract where you store your ETH funds as collateral in order to take out a loan. Maker’s CDP allows you to take out a decentralized loan denominated in DAI stable coin.
As an ETH hodler, why should I care?
Suppose, as a true believer in Ethereum, you have invested all your available fiat into ETH already. Suddenly, there is a market situation such that you would like to “buy the dip” or simply increase your stack of ETH but you cannot since you have no fiat left. Nevertheless, thanks to CDP you can lock your already owned ETH as a collateral, take out a loan in DAI (~USD), and buy more ETH with it. This is called leverage and the principle is the same as margin trading.
What is the catch you are not telling me?
Well, the catch is that you have to repay your money otherwise your CDP gets liquidated and/or you lose your collateral. Please, never let your CDP liquidate! It is way more expensive than repaying.
Can you give an example of a bad loan setup?
Suppose you lock 150 ETH in CDP, Ether price is currently 900 USD. The max collateral/loan ratio of Maker CDP is currently set to 150%. Therefore, you can take out 90 000 DAI (100ETH*price) as a loan. Remember the loan is always in DAI. However, since you borrowed the maximum amount allowed (two-thirds of collateral), your liquidation price is exactly 900. If the price drops to 899.9, your CDP will be liquidated because its collateral is insufficient. Always make sure the liquidation price is sufficiently low.
OK, I see I shouldn’t go too much into debt here. Is that all?
No, there is another case that may arise. Suppose the previous situation, however, you take out only 30k Dai instead of 90k. Since your collateral/loan ratio is now higher, you are protected from liquidation as long as the price of ETH is above the liquidation price of around 300 USD (sounds sufficient). Remember again that the loan is denominated in DAI. If the ETH price goes to 500 USD, nothing changes and you still owe 30k DAI. This may cause issues when investing the borrowed funds. Suppose you invested the whole loan in ETH at the initial price of 900 but now one is worth 500 and you have no other money available. The CDP does not go into liquidation this time. However, you cannot repay the debt and free your collateral (you can partially but it’s still quite bad).
What do you suggest to avoid this?
If you plan to invest the borrowed DAI, never collateralize your entire bag of ETH. Always save an appropriate amount of money (form irrelevant) to be able to pay off the CDP at liquidation prices.
How do I find out how much is “appropriate”?
You need to do the math. I derived some formulas that may be helpful. They apply to the case of leveraging ETH only, i.e. using your bag of ETH to get a loan and invest in ETH again. As have been mentioned, you should have enough ETH left elsewhere to be prepared to repay the debt if the price begins to approach the liquidation price. I assume the purchase of ETH is at the same price as at the time the CDP is opened.
Notation: S = all ETH holdings you have prior to CDP, P = the current price of ETH in USD, LP = your desired liquidation price (yes, this is a parameter you must choose – please be cautious and set it at a safe low level that you consider unlikely to be reached)
Calculating the amount of ETH to deposit as collateral (deposit): D = S/[1-(2LP-2P)/3P]
Calculating the amount of DAI to “draw” from the CDP (loan): L = (2/3) *D *LP
Remember, you must always have S-D amount of ETH available to step in and avoid liquidation of your CDP. That should guarantee you are safe from the liquidation or the need to use additional funds. Nevertheless, it is still possible your investments will not be profitable and you end up losing money.
I am only waiting for the next paycheck and need the funds only temporarily to buy the dip right now. Can I collateralize my whole stack of ETH?
Yes, you can since you know you will get additional funds to repay the debt. However, remember not to go too much into debt to avoid liquidation.
I used the loan to buy ETH. Can I collateralize these funds as well?
Yes, you can but be VERY careful. You’d better do the math right! I would not recommend this since things may get messy and you may lose track of your debt easily.
I want to learn more and maybe get a CDP. What should I do next?
You should check the Maker CDP dashboard (https://dai.makerdao.com/) out and watch their introductory video and terminology guide. There is a couple of advanced things that I omitted and you should look into them (e.g. WETH, PETH). Further, visit the maker subreddit r/makerdao (please read the sad stories of liquidated CDPs) or other of their communities. Make sure you understand what you are doing before creating a CDP. It may be worth it to test the process on the Kovan testnet.
Why did you write this tutorial?
There was no complex material for beginners around that would highlight CDP’s possibilities as well as risks. I hope I introduced the instrument properly and it will get more traction eventually. Also, I am a big fan of the DAI stable coin.
I think there is something wrong in this text or something important is missing.
That is, of course, possible. In such a case, please, comment or pm me. I will be updating this text continuously.
DISCLAIMER: This is not an investment advice or strategy; only an introductory material. If interested in using CDP, you should read more detailed materials involving more detailed descriptions of the liquidation process, fees, etc. Also, always do the math yourself and check your results. Do not trust the provided formulas if you have not checked they apply to your situation. Make sure you understand what you are doing. Be cautious and stay safe.
https://kinematec.de/wp-content/uploads/2018/02/fwefewfewfew.png9841882christianhttps://kinematec.de/wp-content/uploads/2019/10/kinematec_logo.pngchristian2018-02-12 07:15:272018-03-04 08:47:32Leveraging your long ETH position with Maker’s CDP: A brief introduction/tutorial for hodlers
Cryptoasset prices have been quite turbulent in the past few weeks. At times like this it’s especially important to look at the fundamental foundations of cryptoasset prices, and quantitative metrics. Today I will share with you one of the main metrics we use in our investing decisions at Cryptolab Capital.
Emerging field of cryptoeconomic ratio analysis
In traditional finance, ratio analysis is one of the most widely used valuation methods. Lacking the detail of other valuation approaches, such as DCF analysis, ratio-based valuation is much faster and is still a good proxy of fair value. It also allows one to easily track asset price dynamic over long periods of time as well as compare different assets to each other.
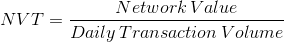
Over the course of the last year, a new study of cryptoeconomic ratio analysis emerged. The main idea behind this new field is to study the relationship between price of a cryptoasset and its fundamentals. One of the most widely known ratios is Network Value to Transactions, or NVT. Introduced and popularized by Chris Burniske, Willy Woo, and the team behind Coinmetrics, NVT is often called “crypto PE ratio.” Here’s the definition of the ratio:
In a traditional PE ratio, the earnings metric in the denominator is used as a proxy for the underlying utility of the company created for the shareholders. While cryptoassets don’t have earnings, one can argue that the total value of transactions flowing through the network is a proxy for how much utility users derive from the chain. It is worth highlighting that Daily Transaction Volume in NVT takes into account only on-chain transactions. All the trading activity that happens on exchanges and is, for the most part, speculative is not included in this volume.
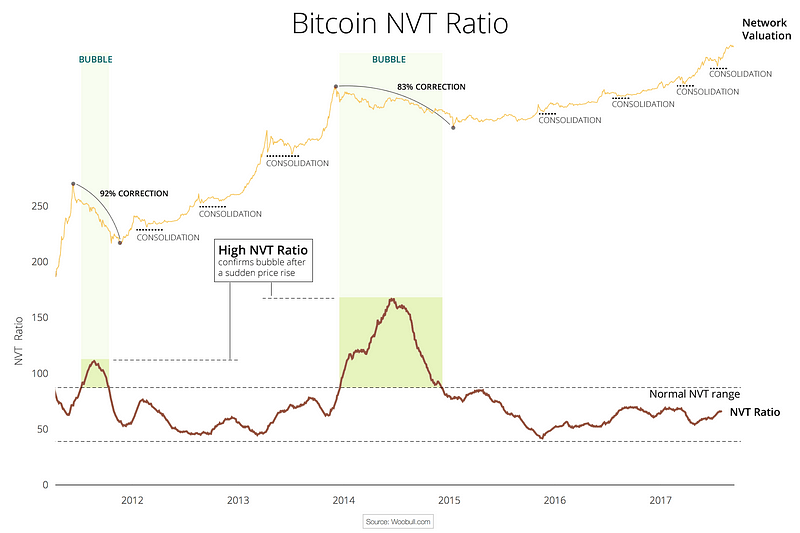
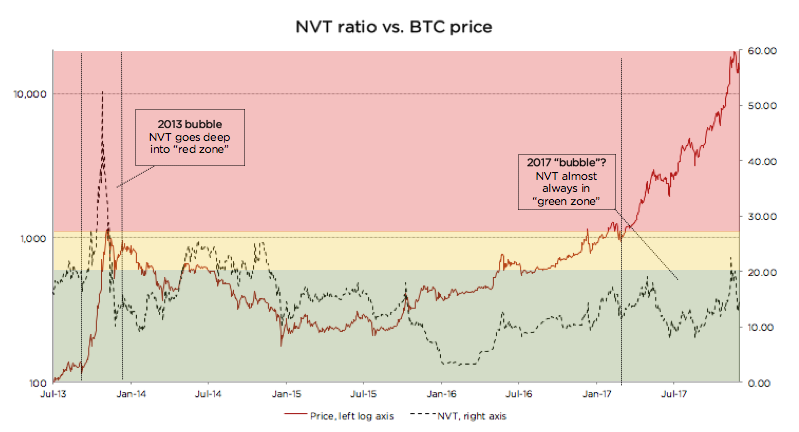
This Forbes article argues that NVT can be successfully used to detect bitcoin price bubbles when valuation is not supported by fundamentals and differentiate them from consolidations. The chart below concisely illustrates this argument.
This chart also greatly illustrates what we at Cryptolab Capital don’t like about NVT in its current form. The spike in NVT follows the bubble with a considerable lag of a few months. Peak NVT coincides with the middle of a correction period. NVT is neither predictive (doesn’t precede the overvaluation), nor descriptive (doesn’t coincide with it). You can only detect the bubble a few months after it bursts.
Rethinking NVT ratio
Trying to dissect this issue and improve this ratio, we started by looking at the ratio definition:
“Ratio has been smoothed using moving averages, 14 day forward and 14 day backward facing…”
Mathematically speaking, this means the following:
Hereinafter:
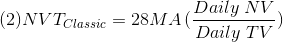
NVT_Classic stands for “Classic definition of NVT”
28 MA is “28-day Moving Average”
NV is “Network Value in USD”
TV is “Transaction Volume in USD”
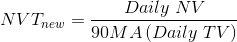
Let’s pause here and look back at the conceptual meaning of NVT. In this ratio, Transaction Volume is used as a proxy for fundamental network utility value. When you look at Transaction Volume on a daily basis, there is a lot of noise, so I completely agree with the decision to smooth it by using a 28-day Moving Average. But we asked ourselves a few questions:
Why 28 days, and not 10, 30, 90, or 180? A 28-day average might be not enough for a truly fundamental metric.
Why 14 days forward and backward? If we are trying to develop a predictive, or at least descriptive, indicator we shouldn’t rely on future data.
Do we need to smooth both parameters — ratio as a whole — or just the denominator?
We then experimented with different Moving Average periods, and came to an empiric conclusion that the optimal solution is to divide daily Network Value by 90 days Moving Average of Transaction Volume. So here’s a definition of our new NVT ratio:
Comparing old and new NVT for bitcoin
Source: author’s calculations
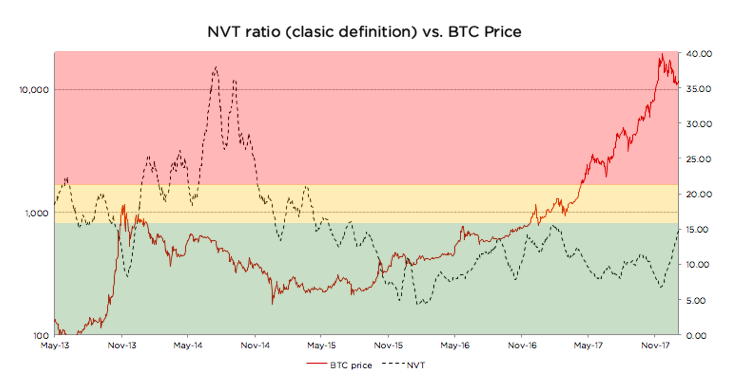
As can be seen from the chart above, when we move from a 28-day Moving Average to a 90-day Moving Average NVT definition, we get rid of the time lag issue described above. We can also see that every time NVT went to the Yellow or Red zone (autumn 2013, spring 2014, December 2017), a price correction followed.
We claim that this refined NVT ratio is a better descriptive metric of bitcoin bubbles. Conceptually, this makes sense. Given that Transaction Volume in NVT is a proxy for fundamental utility value of the network, a 90-day Moving Average is a better proxy for long-term fundamental value than a 28-day Moving Average.
Let’s now look at the recent bitcoin price performance using the refined NVT ratio in more detail. From January until mid-December 2017, bitcoin has appreciated almost 20x. For the most part of this rally, though, NVT ratio has stayed in the Green Zone. However, in December when price reached almost $20,000, NVT went into the Yellow for a few days. This rapid appreciation was shortly followed by a 30% price correction, and another even steeper price correction in the last weeks. After the correction, NVT has returned to the Green zone. This is another empiric evidence in support of 90 MA NVT.
Looking at the chart below, it is much harder (if at all possible) to foresee the December 2017 correction. Quite the opposite, during late 2017 price rally, NVT went down! How can it be?
Source: author’s calculations
There is a non-static non-linear relationship between the numerator and denominator of NVT. Every time there’s a sharp increase in price, there’s growth in trading activity (off-chain transactions) that is shortly followed by on-chain transaction volume growth as investors liquidate their positions. Exchanges and wallets trade with each other to provide liquidity to their users. All this activity increases on-chain transaction volume, even though it is fully speculative.
In other words, the cryptoassets exhibit reflexivity. In the short run, the price changes the fundamentals. In this case, transaction volume follows price. I don’t want to go into much detail on this, but I can refer you to an excellent article on the topic by the Coinmetrics team: “Mean-reversion and reflexivity: a Litecoin case study”.
So why does a longer period average result in a better indicator? Intuitively it makes sense. By definition, the role of Transaction Volume in the NVT denominator is to be a proxy for fundamental utility that users get from using the network. A longer smoothing period helps to get rid of the reflexivity effects described above — spikes in transaction volume that follow sharp price increase. These irregularities are speculation-driven and are bad descriptors of fundamental intrinsic utility of the network. When we remove these irregularities, we end up with a better proxy for fundamental value in NVT denominator, and, as a result, the new NVT ratio becomes a better descriptor of price level.
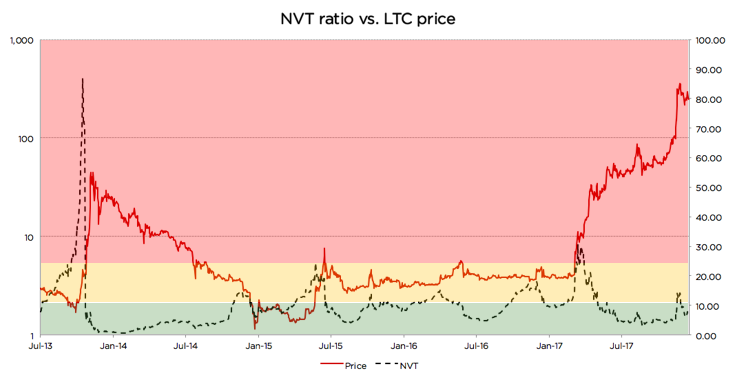
Analyzing Litecoin using the refined NVT
Source: author’s calculations
Looking at the chart, we can see that there were at least 3 cases since 2013 when the same logic applied: price spikes coincided with, or in some cases were even preceded by, spikes in 90-day NVT
Autumn 2013
Summer 2015
Autumn 2015
Late 2017
However, in a few cases it didn’t work as well. Those cases are usually explained by a strong trend or some big external news:
In late 2014, an NVT spike happened during a one-year-long price correction, and the price just kept going down. A similar dynamic can be seen on the BTC graph above during the correction of the second half of 2014. NVT spiked a couple of times while BTC price was steadily declining.
Most interestingly, in April 2017 NVT spiked really high, but price actually went up! Here there were a couple of strong external factors: (1) SegWit adoption speculation, and more importantly, (2) listing on Coinbase in May that propelled asset price to a whole new level and moved LTC to another league. The price did increase significantly, but the fundamentals shortly followed.
Despite these exceptions, the descriptive power of the refined NVT for detection of overvaluation is still quite strong. It is definitely stronger than that of the currently used NVT.
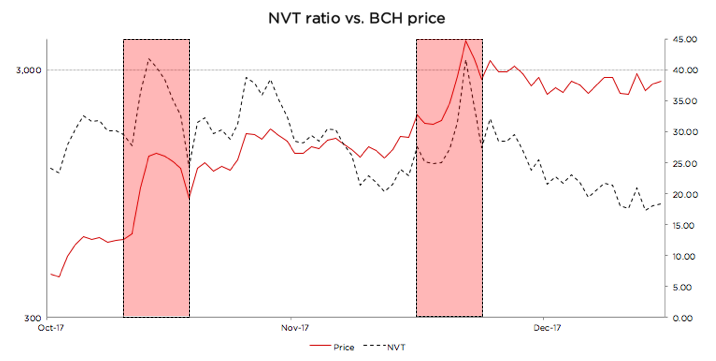
Using new NVT for BCash
Source: author’s calculations
BCash is quite new, and its history has been full of breaking news, hostile attacks on bitcoin, and other exogenous events. Given this, it is hard for us to define the limits of the Green, Yellow, and Red zones for this currency. If we were forced to state Cryptolab Capital’s opinion, we would likely say it is rather overvalued at the moment, the NVT might still be in the Red zone, and the fundamentals have to catch up for the price to make sense.
But one thing that can be seen from the chart above is the sharp NVT spikes coincide perfectly with local price maxima. Yet another win for redefined NVT.
Summary
For every investor it is of crucial importance to understand what is going on in the market right now. As a result of Cryptolab Capital research, we have designed a metric that describes price bubbles well and without a time lag across different time periods and assets.
There is, however, another more fundamental weakness of NVT. It only takes into account total value of on-chain transactions, but it doesn’t factor in the number of transactions or the number of addresses (wallets) participating in these transactions. Let’s call this metric Daily Active Addresses (DAA).
For internet companies, especially marketplaces, social networks, and other businesses with strong network effects, the analogous Daily Active Users (DAU) indicator is one of the most important performance and valuation metrics. This and other metrics that now make up the language of valuing internet companies didn’t exist in the 1990s. It has been developed by technology investors over the last 20+ years. Similar valuation framework for cryptoassets is yet to be developed and is only starting to form.
In our next post, we will try to contribute to this framework and propose a way to use Daily Active Addresses (DAA) in cryptoasset network valuation.
Acknowledgements
I wanted to thank a few people who contributed to my understanding of cryptoasset investing, and gave valuable feedback in the process of this research:
https://kinematec.de/wp-content/uploads/2018/02/deewde.png11341769christianhttps://kinematec.de/wp-content/uploads/2019/10/kinematec_logo.pngchristian2018-02-04 07:07:152018-02-12 07:10:18Rethinking Network Value to Transactions (NVT) Ratio
Wir können Cookies anfordern, die auf Ihrem Gerät eingestellt werden. Wir verwenden Cookies, um uns mitzuteilen, wenn Sie unsere Websites besuchen, wie Sie mit uns interagieren, Ihre Nutzererfahrung verbessern und Ihre Beziehung zu unserer Website anpassen.
Klicken Sie auf die verschiedenen Kategorienüberschriften, um mehr zu erfahren. Sie können auch einige Ihrer Einstellungen ändern. Beachten Sie, dass das Blockieren einiger Arten von Cookies Auswirkungen auf Ihre Erfahrung auf unseren Websites und auf die Dienste haben kann, die wir anbieten können.
Notwendige Website Cookies
Diese Cookies sind unbedingt erforderlich, um Ihnen die auf unserer Webseite verfügbaren Dienste und Funktionen zur Verfügung zu stellen.
Da diese Cookies für die auf unserer Webseite verfügbaren Dienste und Funktionen unbedingt erforderlich sind, hat die Ablehnung Auswirkungen auf die Funktionsweise unserer Webseite. Sie können Cookies jederzeit blockieren oder löschen, indem Sie Ihre Browsereinstellungen ändern und das Blockieren aller Cookies auf dieser Webseite erzwingen. Sie werden jedoch immer aufgefordert, Cookies zu akzeptieren / abzulehnen, wenn Sie unsere Website erneut besuchen.
Wir respektieren es voll und ganz, wenn Sie Cookies ablehnen möchten. Um zu vermeiden, dass Sie immer wieder nach Cookies gefragt werden, erlauben Sie uns bitte, einen Cookie für Ihre Einstellungen zu speichern. Sie können sich jederzeit abmelden oder andere Cookies zulassen, um unsere Dienste vollumfänglich nutzen zu können. Wenn Sie Cookies ablehnen, werden alle gesetzten Cookies auf unserer Domain entfernt.
Wir stellen Ihnen eine Liste der von Ihrem Computer auf unserer Domain gespeicherten Cookies zur Verfügung. Aus Sicherheitsgründen können wie Ihnen keine Cookies anzeigen, die von anderen Domains gespeichert werden. Diese können Sie in den Sicherheitseinstellungen Ihres Browsers einsehen.
Andere externe Dienste
Wir nutzen auch verschiedene externe Dienste wie Google Webfonts, Google Maps und externe Videoanbieter. Da diese Anbieter möglicherweise personenbezogene Daten von Ihnen speichern, können Sie diese hier deaktivieren. Bitte beachten Sie, dass eine Deaktivierung dieser Cookies die Funktionalität und das Aussehen unserer Webseite erheblich beeinträchtigen kann. Die Änderungen werden nach einem Neuladen der Seite wirksam.
Google Webfont Einstellungen:
Google Maps Einstellungen:
Google reCaptcha Einstellungen:
Vimeo und YouTube Einstellungen:
Datenschutzrichtlinie
Sie können unsere Cookies und Datenschutzeinstellungen im Detail in unseren Datenschutzrichtlinie nachlesen.