This is a simple working example of a flash arbitrage smart contract, whereby within a single transaction it:
Instantly flash borrows a certain asset (ETH in this example) from Aave lending pools with zero collateral
Calls UniswapV2 Router02 to wrap the flash liquidity of ETH into WETH and exchange it for DAI tokens
Checks the exchange rate of DAI back into ETH on Sushiswap V1
Calls SushiswapV1 Router02 to swap the DAI back into WETH and then ETH
There’s also an independent function to withdraw all ETH and ERC20 tokens at the contract owner’s discretion
Before you start playing with this I highly recommend to have a read of the Aave Flash Loan mechanism and get an indepth conceptual understanding, as it’s equally important as understanding the code.
Since Sushiswap is a fork of UniswapV2, I also suggest familiarising yourself with the Uniswap V2 guide on trading via smart contracts, particularly if you plan on adding more swaps to your arbitrage strategy.
Deployment
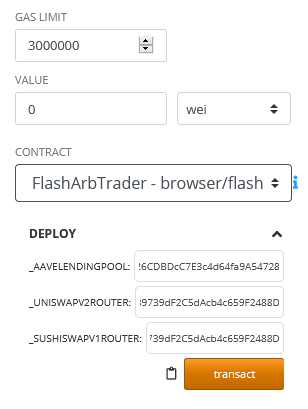
The contract can be plonked directly onto Remix, using solidity compiler 0.6.12, and Metamask using Injected Web3.
On deployment, set the following parameters:
_AaveLendingPool: the LendingPoolAddressesProvider address corresponding to the deployment environment. see Deployed Contract Instances.
_UniswapV2Router: the Router02 address for UniswapV2 see here.
_SushiswapV1Router: the Router02 address for SushiswapV1. There isn’t an official testnet router02 so for demo purposes you can just use the uniswapV2 address when playing on the testnet since their codebase is identical (for now – which may not be the case in the future). Alternatively see Sushiswap repo for the mainnet router02 address to test in prod or deploy your own version of Router02 onto testnet.
Click ‚transact‘ and approve the Metamask pop up.
Once the flash arb contract is deployed, send some ETH or ERC20 token to this contract depending on what asset you’re planning to flash borrow from Aave in case you need extra funds to cover the flash fee.
Execution
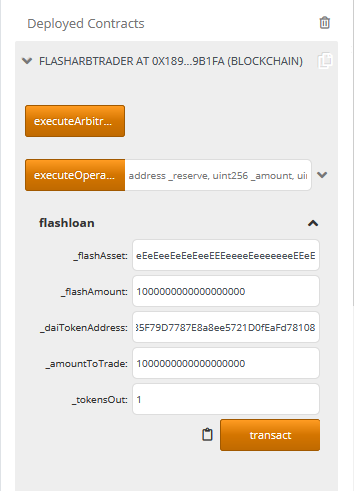
On execution, set the following parameters:
_flashAsset: address of the asset you want to flash loan. e.g. ETH is 0xEeeeeEeeeEeEeeEeEeEeeEEEeeeeEeeeeeeeEEeE. If you want to flash anything else see Reserved Assets but you will need to adjust the executeArbitrage() function accordingly.
_flashAmount: how much of _flashAsset you want to borrow, demoniated in wei (e.g. 1000000000000000000 for 1 ether).
_daiTokenAddress: for this demo we’re swapping with the DAI token, so lookup the reserved address of the DAI token. See Reserved Assets.
_amountToTrade: how much of the newly acquired _flashAsset you’d like to use as part of this arbitrage.
_tokensOut: how much of the ERC20 tokens from the first swap would you like to swap back to complete the arb. Denominated in actual tokens, i.e. 1 = 1 DAI token.
Click ‚transact‘ and approve in Metamask.
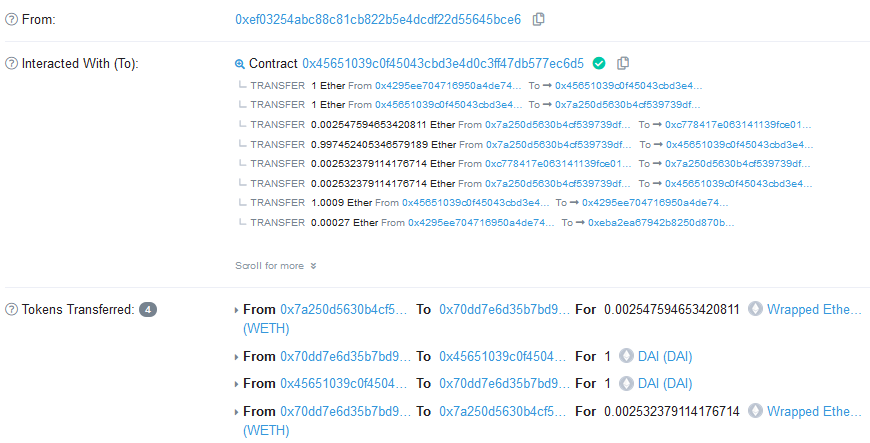
Result
If all goes well, a successful execution of this contract looks like this (Ropsten testnet).
Tips for further customization
This contract would typically be executed by a NodeJS bot (not part of this demo) via a web3.eth.Contract() call, referencing the deployed address of this contract and its corresponding ABI. You would usually get the bot to interact with price aggregators such as 1inch to assess arb opportunities and execute this contract if the right opportunity is found.
To have any chance of getting in front of other arb bots on significant arb opportunities the NodeJS bot needs to be hosted on your own fast Ethereum node. You will most likely come off second best going through the Infura API to interact with the Ethereum blockchain.
Some people like to get an unfair advantage by building Transaction-Ordering Dependence (front running) capabilities into the NodeJS component, typically using web3.eth.subscribe(‚pendingTransactions‘..) to monitor for newly submitted arb TXs. However this smart contract would then need to be significantly more complex and flexible enough to cater for a wide range of arbitrage permutations across multiple protocols.
User specified parameters (as opposed to hardcoded variables) should be passed via the flashloan() function in the first instance. You can subsequently set these parameters to contract variables with higher visibility across the contract.
There are no direct ETH pairs in UniswapV2 therefore the need for a WETH wrapper. Since Sushiswap is forked from UniswapV2 you’ll need to wrap in WETH as well.
If you found this useful and would like to send me some gas money:
The Facebooks and Googles of the world are getting rich off your data. Market researchers at PwC estimate that in 2018, companies that collect personal data to use for targeted advertising brought in $178 billion in revenue. Data brokers last year earned a further $21 billion. And these numbers are only trending up. By 2025, PwC expects the global data economy to be worth more than $400 billion.
So it’s about time we get in on the action, right?
https://kinematec.de/wp-content/uploads/2019/05/data.png513777christianhttps://kinematec.de/wp-content/uploads/2019/10/kinematec_logo.pngchristian2019-05-30 10:53:232019-09-20 09:06:17Sell Your Data. Earn Passive Income. What Could Go Wrong?
DISCLAIMER: This is not an investment advice or strategy; only an introductory material. If interested in using CDP, you should read more detailed materials involving more detailed descriptions of the liquidation process, fees, etc. Also, always do the math yourself and check your results. Do not trust the provided formulas if you have not checked they apply to your situation. Make sure you understand what you are doing. Be cautious and stay safe.
What is a CDP?
CDP is a Collateralized Debt Position, a smart contract where you store your ETH funds as collateral in order to take out a loan. Maker’s CDP allows you to take out a decentralized loan denominated in DAI stable coin.
As an ETH hodler, why should I care?
Suppose, as a true believer in Ethereum, you have invested all your available fiat into ETH already. Suddenly, there is a market situation such that you would like to “buy the dip” or simply increase your stack of ETH but you cannot since you have no fiat left. Nevertheless, thanks to CDP you can lock your already owned ETH as a collateral, take out a loan in DAI (~USD), and buy more ETH with it. This is called leverage and the principle is the same as margin trading.
What is the catch you are not telling me?
Well, the catch is that you have to repay your money otherwise your CDP gets liquidated and/or you lose your collateral. Please, never let your CDP liquidate! It is way more expensive than repaying.
Can you give an example of a bad loan setup?
Suppose you lock 150 ETH in CDP, Ether price is currently 900 USD. The max collateral/loan ratio of Maker CDP is currently set to 150%. Therefore, you can take out 90 000 DAI (100ETH*price) as a loan. Remember the loan is always in DAI. However, since you borrowed the maximum amount allowed (two-thirds of collateral), your liquidation price is exactly 900. If the price drops to 899.9, your CDP will be liquidated because its collateral is insufficient. Always make sure the liquidation price is sufficiently low.
OK, I see I shouldn’t go too much into debt here. Is that all?
No, there is another case that may arise. Suppose the previous situation, however, you take out only 30k Dai instead of 90k. Since your collateral/loan ratio is now higher, you are protected from liquidation as long as the price of ETH is above the liquidation price of around 300 USD (sounds sufficient). Remember again that the loan is denominated in DAI. If the ETH price goes to 500 USD, nothing changes and you still owe 30k DAI. This may cause issues when investing the borrowed funds. Suppose you invested the whole loan in ETH at the initial price of 900 but now one is worth 500 and you have no other money available. The CDP does not go into liquidation this time. However, you cannot repay the debt and free your collateral (you can partially but it’s still quite bad).
What do you suggest to avoid this?
If you plan to invest the borrowed DAI, never collateralize your entire bag of ETH. Always save an appropriate amount of money (form irrelevant) to be able to pay off the CDP at liquidation prices.
How do I find out how much is “appropriate”?
You need to do the math. I derived some formulas that may be helpful. They apply to the case of leveraging ETH only, i.e. using your bag of ETH to get a loan and invest in ETH again. As have been mentioned, you should have enough ETH left elsewhere to be prepared to repay the debt if the price begins to approach the liquidation price. I assume the purchase of ETH is at the same price as at the time the CDP is opened.
Notation: S = all ETH holdings you have prior to CDP, P = the current price of ETH in USD, LP = your desired liquidation price (yes, this is a parameter you must choose – please be cautious and set it at a safe low level that you consider unlikely to be reached)
Calculating the amount of ETH to deposit as collateral (deposit): D = S/[1-(2LP-2P)/3P]
Calculating the amount of DAI to “draw” from the CDP (loan): L = (2/3) *D *LP
Remember, you must always have S-D amount of ETH available to step in and avoid liquidation of your CDP. That should guarantee you are safe from the liquidation or the need to use additional funds. Nevertheless, it is still possible your investments will not be profitable and you end up losing money.
I am only waiting for the next paycheck and need the funds only temporarily to buy the dip right now. Can I collateralize my whole stack of ETH?
Yes, you can since you know you will get additional funds to repay the debt. However, remember not to go too much into debt to avoid liquidation.
I used the loan to buy ETH. Can I collateralize these funds as well?
Yes, you can but be VERY careful. You’d better do the math right! I would not recommend this since things may get messy and you may lose track of your debt easily.
I want to learn more and maybe get a CDP. What should I do next?
You should check the Maker CDP dashboard (https://dai.makerdao.com/) out and watch their introductory video and terminology guide. There is a couple of advanced things that I omitted and you should look into them (e.g. WETH, PETH). Further, visit the maker subreddit r/makerdao (please read the sad stories of liquidated CDPs) or other of their communities. Make sure you understand what you are doing before creating a CDP. It may be worth it to test the process on the Kovan testnet.
Why did you write this tutorial?
There was no complex material for beginners around that would highlight CDP’s possibilities as well as risks. I hope I introduced the instrument properly and it will get more traction eventually. Also, I am a big fan of the DAI stable coin.
I think there is something wrong in this text or something important is missing.
That is, of course, possible. In such a case, please, comment or pm me. I will be updating this text continuously.
DISCLAIMER: This is not an investment advice or strategy; only an introductory material. If interested in using CDP, you should read more detailed materials involving more detailed descriptions of the liquidation process, fees, etc. Also, always do the math yourself and check your results. Do not trust the provided formulas if you have not checked they apply to your situation. Make sure you understand what you are doing. Be cautious and stay safe.
https://kinematec.de/wp-content/uploads/2018/02/fwefewfewfew.png9841882christianhttps://kinematec.de/wp-content/uploads/2019/10/kinematec_logo.pngchristian2018-02-12 07:15:272018-03-04 08:47:32Leveraging your long ETH position with Maker’s CDP: A brief introduction/tutorial for hodlers
Cryptoasset prices have been quite turbulent in the past few weeks. At times like this it’s especially important to look at the fundamental foundations of cryptoasset prices, and quantitative metrics. Today I will share with you one of the main metrics we use in our investing decisions at Cryptolab Capital.
Emerging field of cryptoeconomic ratio analysis
In traditional finance, ratio analysis is one of the most widely used valuation methods. Lacking the detail of other valuation approaches, such as DCF analysis, ratio-based valuation is much faster and is still a good proxy of fair value. It also allows one to easily track asset price dynamic over long periods of time as well as compare different assets to each other.
Over the course of the last year, a new study of cryptoeconomic ratio analysis emerged. The main idea behind this new field is to study the relationship between price of a cryptoasset and its fundamentals. One of the most widely known ratios is Network Value to Transactions, or NVT. Introduced and popularized by Chris Burniske, Willy Woo, and the team behind Coinmetrics, NVT is often called “crypto PE ratio.” Here’s the definition of the ratio:
In a traditional PE ratio, the earnings metric in the denominator is used as a proxy for the underlying utility of the company created for the shareholders. While cryptoassets don’t have earnings, one can argue that the total value of transactions flowing through the network is a proxy for how much utility users derive from the chain. It is worth highlighting that Daily Transaction Volume in NVT takes into account only on-chain transactions. All the trading activity that happens on exchanges and is, for the most part, speculative is not included in this volume.
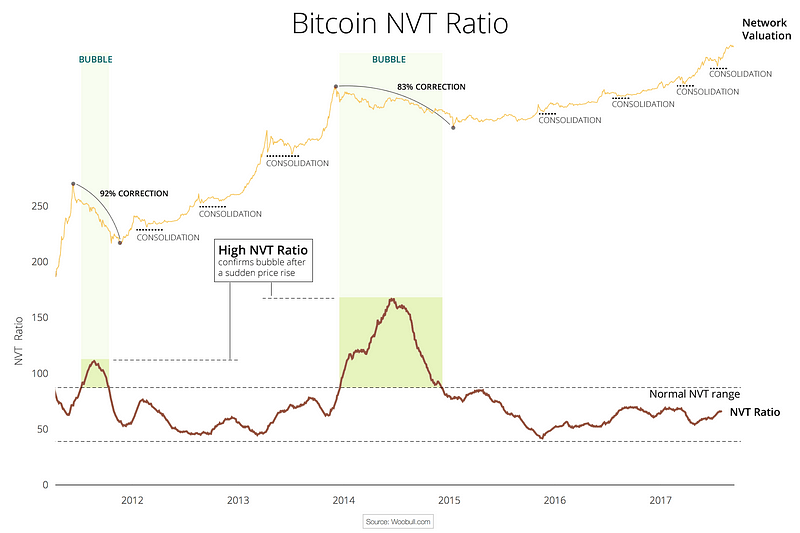
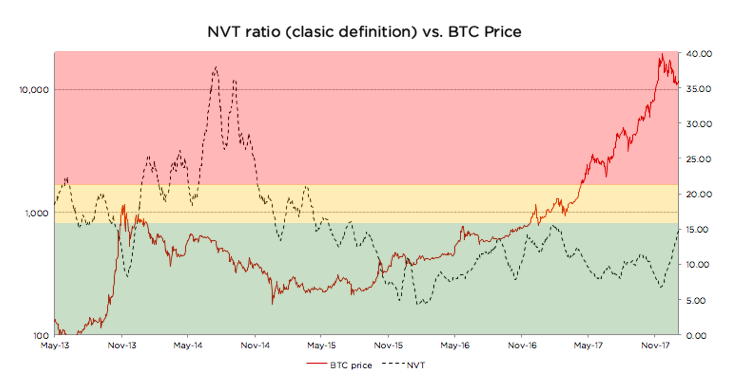
This Forbes article argues that NVT can be successfully used to detect bitcoin price bubbles when valuation is not supported by fundamentals and differentiate them from consolidations. The chart below concisely illustrates this argument.
This chart also greatly illustrates what we at Cryptolab Capital don’t like about NVT in its current form. The spike in NVT follows the bubble with a considerable lag of a few months. Peak NVT coincides with the middle of a correction period. NVT is neither predictive (doesn’t precede the overvaluation), nor descriptive (doesn’t coincide with it). You can only detect the bubble a few months after it bursts.
Rethinking NVT ratio
Trying to dissect this issue and improve this ratio, we started by looking at the ratio definition:
“Ratio has been smoothed using moving averages, 14 day forward and 14 day backward facing…”
Mathematically speaking, this means the following:
Hereinafter:
NVT_Classic stands for “Classic definition of NVT”
28 MA is “28-day Moving Average”
NV is “Network Value in USD”
TV is “Transaction Volume in USD”
Let’s pause here and look back at the conceptual meaning of NVT. In this ratio, Transaction Volume is used as a proxy for fundamental network utility value. When you look at Transaction Volume on a daily basis, there is a lot of noise, so I completely agree with the decision to smooth it by using a 28-day Moving Average. But we asked ourselves a few questions:
Why 28 days, and not 10, 30, 90, or 180? A 28-day average might be not enough for a truly fundamental metric.
Why 14 days forward and backward? If we are trying to develop a predictive, or at least descriptive, indicator we shouldn’t rely on future data.
Do we need to smooth both parameters — ratio as a whole — or just the denominator?
We then experimented with different Moving Average periods, and came to an empiric conclusion that the optimal solution is to divide daily Network Value by 90 days Moving Average of Transaction Volume. So here’s a definition of our new NVT ratio:
Comparing old and new NVT for bitcoin
Source: author’s calculations
As can be seen from the chart above, when we move from a 28-day Moving Average to a 90-day Moving Average NVT definition, we get rid of the time lag issue described above. We can also see that every time NVT went to the Yellow or Red zone (autumn 2013, spring 2014, December 2017), a price correction followed.
We claim that this refined NVT ratio is a better descriptive metric of bitcoin bubbles. Conceptually, this makes sense. Given that Transaction Volume in NVT is a proxy for fundamental utility value of the network, a 90-day Moving Average is a better proxy for long-term fundamental value than a 28-day Moving Average.
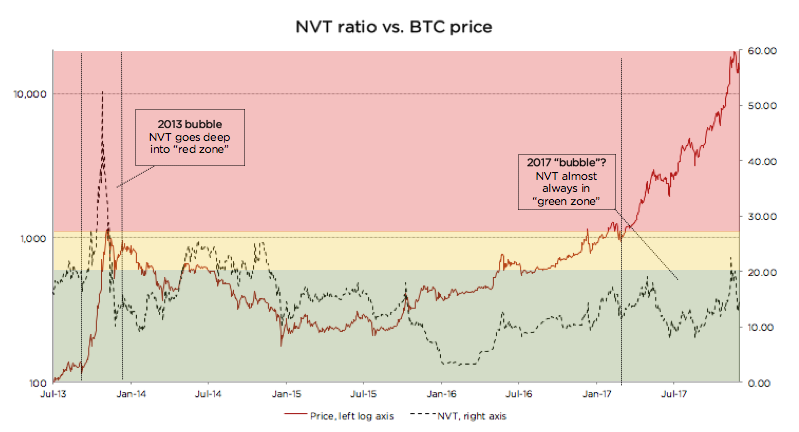
Let’s now look at the recent bitcoin price performance using the refined NVT ratio in more detail. From January until mid-December 2017, bitcoin has appreciated almost 20x. For the most part of this rally, though, NVT ratio has stayed in the Green Zone. However, in December when price reached almost $20,000, NVT went into the Yellow for a few days. This rapid appreciation was shortly followed by a 30% price correction, and another even steeper price correction in the last weeks. After the correction, NVT has returned to the Green zone. This is another empiric evidence in support of 90 MA NVT.
Looking at the chart below, it is much harder (if at all possible) to foresee the December 2017 correction. Quite the opposite, during late 2017 price rally, NVT went down! How can it be?
Source: author’s calculations
There is a non-static non-linear relationship between the numerator and denominator of NVT. Every time there’s a sharp increase in price, there’s growth in trading activity (off-chain transactions) that is shortly followed by on-chain transaction volume growth as investors liquidate their positions. Exchanges and wallets trade with each other to provide liquidity to their users. All this activity increases on-chain transaction volume, even though it is fully speculative.
In other words, the cryptoassets exhibit reflexivity. In the short run, the price changes the fundamentals. In this case, transaction volume follows price. I don’t want to go into much detail on this, but I can refer you to an excellent article on the topic by the Coinmetrics team: “Mean-reversion and reflexivity: a Litecoin case study”.
So why does a longer period average result in a better indicator? Intuitively it makes sense. By definition, the role of Transaction Volume in the NVT denominator is to be a proxy for fundamental utility that users get from using the network. A longer smoothing period helps to get rid of the reflexivity effects described above — spikes in transaction volume that follow sharp price increase. These irregularities are speculation-driven and are bad descriptors of fundamental intrinsic utility of the network. When we remove these irregularities, we end up with a better proxy for fundamental value in NVT denominator, and, as a result, the new NVT ratio becomes a better descriptor of price level.
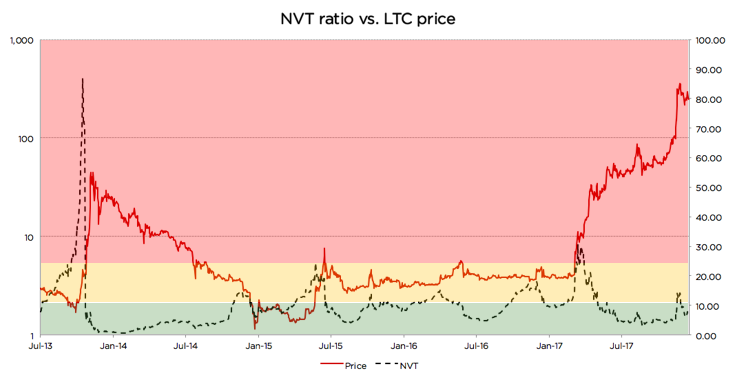
Analyzing Litecoin using the refined NVT
Source: author’s calculations
Looking at the chart, we can see that there were at least 3 cases since 2013 when the same logic applied: price spikes coincided with, or in some cases were even preceded by, spikes in 90-day NVT
Autumn 2013
Summer 2015
Autumn 2015
Late 2017
However, in a few cases it didn’t work as well. Those cases are usually explained by a strong trend or some big external news:
In late 2014, an NVT spike happened during a one-year-long price correction, and the price just kept going down. A similar dynamic can be seen on the BTC graph above during the correction of the second half of 2014. NVT spiked a couple of times while BTC price was steadily declining.
Most interestingly, in April 2017 NVT spiked really high, but price actually went up! Here there were a couple of strong external factors: (1) SegWit adoption speculation, and more importantly, (2) listing on Coinbase in May that propelled asset price to a whole new level and moved LTC to another league. The price did increase significantly, but the fundamentals shortly followed.
Despite these exceptions, the descriptive power of the refined NVT for detection of overvaluation is still quite strong. It is definitely stronger than that of the currently used NVT.
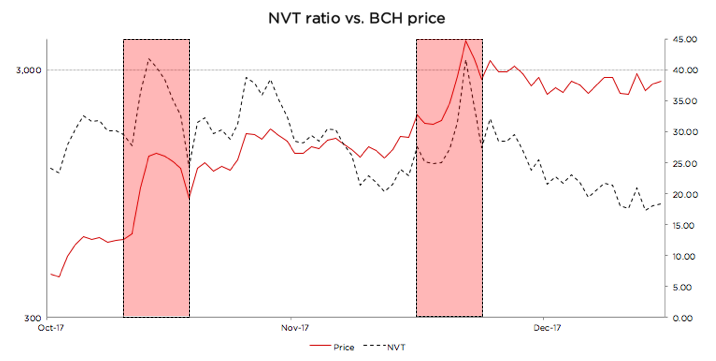
Using new NVT for BCash
Source: author’s calculations
BCash is quite new, and its history has been full of breaking news, hostile attacks on bitcoin, and other exogenous events. Given this, it is hard for us to define the limits of the Green, Yellow, and Red zones for this currency. If we were forced to state Cryptolab Capital’s opinion, we would likely say it is rather overvalued at the moment, the NVT might still be in the Red zone, and the fundamentals have to catch up for the price to make sense.
But one thing that can be seen from the chart above is the sharp NVT spikes coincide perfectly with local price maxima. Yet another win for redefined NVT.
Summary
For every investor it is of crucial importance to understand what is going on in the market right now. As a result of Cryptolab Capital research, we have designed a metric that describes price bubbles well and without a time lag across different time periods and assets.
There is, however, another more fundamental weakness of NVT. It only takes into account total value of on-chain transactions, but it doesn’t factor in the number of transactions or the number of addresses (wallets) participating in these transactions. Let’s call this metric Daily Active Addresses (DAA).
For internet companies, especially marketplaces, social networks, and other businesses with strong network effects, the analogous Daily Active Users (DAU) indicator is one of the most important performance and valuation metrics. This and other metrics that now make up the language of valuing internet companies didn’t exist in the 1990s. It has been developed by technology investors over the last 20+ years. Similar valuation framework for cryptoassets is yet to be developed and is only starting to form.
In our next post, we will try to contribute to this framework and propose a way to use Daily Active Addresses (DAA) in cryptoasset network valuation.
Acknowledgements
I wanted to thank a few people who contributed to my understanding of cryptoasset investing, and gave valuable feedback in the process of this research:
https://kinematec.de/wp-content/uploads/2018/02/deewde.png11341769christianhttps://kinematec.de/wp-content/uploads/2019/10/kinematec_logo.pngchristian2018-02-04 07:07:152018-02-12 07:10:18Rethinking Network Value to Transactions (NVT) Ratio
An Intro to TrueBit: A Scalable, Decentralized Computational Court.
or: “An Intro to Panopticomputers: Code Execution Courts for Scalable, Decentralized Computation”.
The Ethereum community never ceases to amaze me. So many smart people working at the fringes of what’s possible. We haven’t really scratched the surface of what’s possible in the current iteration and we are already seeing amazing new opportunities come to the fore.
For the unenlightened, Ethereum can be described as a distributed “world computer” using blockchain technology. It allows developers the ability to upload code to a blockchain, upon which it executes the code when activated to change some information on a shared ledger. In other words, you can apply arbitrarily complex state changes to a shared, public (relatively) immutable ledger. Every node in the p2p network runs these state changes, whilst specific computers (the miners) make sure these state changes are difficult to reverse (by being rewarded the subsidy & fees). In order to execute state changes & computations one pays proportionally with the cryptocurrency of the platform, ether. The more computations you want to do, the more you will pay for it. The amount of computations are measured in a separate unit, called “gas”.
Valuation methodologies have historically lagged behind the development of the assets they represent. While the Dutch East India Company became the first entity to sell stocks on a public exchange in the early 1600s, it was not until the 20th century that a comprehensive framework for deriving the fundamental value of equity securities was developed. What Graham and Dodd benefited from in 1934 that their predecessors perhaps lacked was a broadly-accepted philosophy of disclosure (eventually codified in the Securities Act of 1933) and, more importantly, a reliable accounting system with unified measurement standards and practices— a common language for discussing value. Without rules of disclosure and requisite accounting conventions, current attempts at studying cryptoasset fundamentals will descend into the Confusion of Confusions that described seventeenth century stock market investment advice.
In this piece, I propose an extension to the prevailing methodology for valuing cryptoassets — one that I hope will alleviate confusion by clarifying the vocabulary used in discussions of value. In the first part of the post, I survey current debates on cryptoasset fundamentals and investigate their core monetary assumptions. I find current valuation models to insufficiently capture the complexities of these conversations, motivating a new approach, which I outline in the second part of this post. The proposed method intends to disjoin demand for commodities and demand for money by placing each asset in a broader economy of return expectations and friction constraints. It is important to note, before continuing, that valuation theorists generally caution against valuation of non-cash-flow-generating assets. As such, the methodologies outlined below remain largely exploratory and imprecise. Nonetheless, I believe these discussions to be valuable in developing directional insights on cryptoasset value, which can be a key lever for projects in optimizing their incentive structures (I write in more detail about this process of ‘mechanism design’ here).
https://kinematec.de/wp-content/uploads/2018/02/rfefwefe.png6881414christianhttps://kinematec.de/wp-content/uploads/2019/10/kinematec_logo.pngchristian2018-01-18 07:02:592018-02-12 07:06:19On Value, Velocity and Monetary Theory
Many cryptocurrency traders like to compare different digital assets by market cap, but a clearer picture of reality can be gained by looking at other metrics.
Although bitcoin was launched as the only cryptocurrency in the world back in 2009, there are now thousands of alternatives that can be traded on various online exchanges. Many cryptocurrency traders track the price of these digital assets on sites like CoinMarketCap.com, but the key metric that is most often used to compare these cryptocurrencies, market cap, can sometimes be misleading.
Having said that, there are a few alternative metrics that can be used to compare the different digital assets found in the world today.
What’s Wrong with Market Cap?
While market cap is usually a useful metric for tracking the total valuation of a company, the same is not true in the world of cryptocurrencies. This is because there are often situations where the units included in the calculation for a coin’s market cap — simply the number of coins multiplied by the current price in US dollars — are not easily available for trade.
For example, the long-forgotten Auroracoin, which was targeted towards citizens of Iceland, was said to have a market cap of over $1 billion back in early 2014, but the reality was that a large number of the coins were locked up and unavailable for trade because they had yet to be airdropped onto the Icelandic public. In reality, the Auroracoin market cap was closer to just over $10 million.
Steem was another notorious example of an inflated cryptocurrency market cap. The market cap was reported as more than $400 million in July 2016, but this was due to a large amount of Steem being locked up as Steem Power, which is used as a sort of fuel to vote on the social media platform built around the token. Much of the new Steem coming into existence was locked up as Steem Power by default, and only a fraction of that new Steem was actually going into circulation.
In addition to these sorts of situations where new supply cannot actually be traded on an exchange, there are also numerous situations where one entity holds a large amount of the coins in existence from the start. If this entity (or a cartel of entities) keep their holdings off exchanges, they can create a situation where there is a meaninglessly high market cap for a coin with not much activity around it.
A study from blockchain analytics company Chainalysis concluded that nearly 4 million bitcoins are likely lost forever, which means the world’s most popular cryptocurrency’s market cap may also be quite misleading.
For example, if Forbes created 1 trillion ForbesCoins out of thin air and then sold one ForbesCoin to someone for $1, that would mean the market cap for ForbesCoin would be $1 trillion. But obviously, that valuation would be worthless information because the market would crash if all of the other ForbesCoins were put on the market.
Long story short: There is a lot of funny business that can go on with cryptocurrency market cap calculations. This is not to say that the market cap metric should be thrown out entirely, just that it needs to be combined with other data points.
Tracking Metcalfe’s Law
Earlier this year, FundStrat co-founder Tom Lee told Business Insider that 94% of bitcoin’s price movements over the past four years can be explained by tracking the number of users on the network. The FundStrat method for tracking user growth combines the number of unique addresses and the USD-denominated transaction volume per address.
This is a model based on Metcalfe’s law, which states that the value of a network is proportional to the square of the number of the users on the network.
It’s unclear if FundStrat adds a requirement for there to be some bitcoin in the counted addresses, but that would make sense to avoid a bit of noise. It costs no money to create a new address, but there is a transaction fee associated with transferring bitcoin to that new address.
It should be noted that this data point may be easily gamed on networks with low transaction fees, even if addresses with no balances are thrown out.
Another possible issue with this method is that new addresses are not necessarily created when users are buying bitcoin and other cryptocurrencies on exchanges (the exchanges hold the funds in their own addresses); however, user growth statistics are sometimes shared by exchanges in the space.
Another metric people have used to value these networks in the past is the number of transactions happening on the network per day. While the bitcoin price effectively grew along with the number of transactions per day in its early days, that trend was broken this year as the price exploded with the number of on-chain transactions per day remaining rather stagnant.
FundStrat’s use of USD-denominated transaction volume rather than the bulk number of transactions is likely a move in the right direction.
More Metrics to Watch
In terms of other data points to watch, it’s best to stick to metrics that are not easily gamed. For now, this could mean some combination of trading volume on exchanges (ignoring exchanges with no fees), the total USD-denominated transaction volume, and the median transaction fee paid to miners.
The easiest way to see there’s something fishy going on with a particular coin’s market cap is by looking at the trading volume on exchanges. A lack of liquidity on exchanges means a whale could come in with a large amount of coin and crash the market at a moment’s notice.
It’s also best to look at monthly volumes rather than daily volumes to avoid spikes caused by the hysteria around a boom or bust in a particular coin on a single day.
With USD-denominated transaction volume, one can see how much activity is actually taking place on the cryptocurrency network’s base layer. By combining this data point with the median transaction fee paid to miners, cryptocurrency networks would be unable to pat their stats by sending meaningless transactions back and forth with large sums of money.
The amount of money collected by miners for transaction fees is another interesting metric to track. This may be the most illuminating data point to watch in terms of learning about the usefulness or desirability of a specific cryptocurrency network. This is effectively the total amount of money that people are willing to pay to use the network on a daily basis.
One thing to keep in mind here is that some of these alternative mechanisms for measuring the value of cryptocurrency networks become worthless on systems with strong privacy guarantees. For example, it is impossible to know how much money is being sent around the Monero and Zcash networks.
https://kinematec.de/wp-content/uploads/2018/01/960x0.jpg640960christianhttps://kinematec.de/wp-content/uploads/2019/10/kinematec_logo.pngchristian2018-01-08 10:51:262018-01-08 10:53:54Comparing Bitcoin and Other Cryptocurrencies by ‚Market Cap‘ Can Be Very Misleading
Blame Mexican drug dealers when you have to report your crypto trades to regulators.
Expert Blog is Cointelegraph’s new series of articles by crypto industry leaders. It covers everything from Blockchain technology and cryptocurrencies to ICO regulation and investment analysis. If you want to become our guest author and get published on Cointelegraph, please send us an email at .
Larry Fink, CEO of the world’s largest asset management company, BlackRock, told a panel at the Institute of International Finance:
„Bitcoin just shows you how much demand for money laundering there is in the world. It’s an index of money laundering.“
Fink’s sentiment about virtual currencies reflected that of an IRS Criminal Investigation division official who told reporters in 2013 – after concluding a multi-jurisdictional investigation and shuttering a $6 billion virtual currency exchange for money laundering:
“If Al Capone were alive today, this is how he would be hiding his money.”
Drugs and money laundering
Recently, the U.S. Drug Enforcement Administration (DEA) published a report that provides an overview of the US efforts to police the global illicit drug trade. The report claims that virtual currencies – Bitcoin, Zcash, Monero, and Ethereum – are increasingly being used in the digital underground to facilitate trade-based money laundering schemes for transnational criminal organizations (TCO).
Over the past 10 years, the drug landscape in the US has vastly changed, with the opioid threat reaching epidemic levels in a significant portion of the country. Drug poisoning is a the leading cause of deaths in the US, with approximately 170 people dying from it every day. The opioid epidemic was declared a national emergency by President Trump last August, when Bitcoin was trading at $4,000.
Mexican TCOs and El Chapo
According to DEA’s report, the Mexican TCOs are the greatest criminal drug threat to the US. In the beginning of this year, when Bitcoin was trading at $1,000, the Sinaloa Cartel kingpin Joaquin Archivaldo Guzman Loera (El Chapo) was extradited by Mexico to the US. The extradition followed Mexico’s recapturing of the fugitive drug lord following his brazen escape from a maximum-security Mexican prison via an elaborate mile-long tunnel that connected to his prison cell.
In the US, El Chapo is facing a long list of criminal charges, including drug trafficking and money laundering, for running one of the most powerful and sophisticated transnational drug trafficking organizations in this world.
DEA’s report ties the extreme success of the Mexican TCOs to multiple factors, such as:
By controlling lucrative southwestern drug smuggling corridors, Mexican TCOs export and transport significant quantities of illegal drugs into the US. El Chapo, in an interview with Rolling Stone magazine, boasted that he could “supply more heroin, methamphetamine, cocaine and marijuana than anybody else in the world.” He proudly took credit for overseeing up to half of the illegal drugs coming into the US from Mexico.
To accomplish this, El Chapo said he had “a fleet of submarines, airplanes, trucks and boats.“ Last year, Mexican law enforcement officials confiscated the Sinaloa Cartel’s 599 aircrafts—a fleet larger than Aero Mexico’s. Some of these airplanes were outfitted with the latest intelligence, surveillance and reconnaissance (ISR) technologies to go undetected by the US border patrol.
After selling the illegal drugs in the US – which brought in $64 billion each year – the Mexican TCOs needed a way to get the drug money back to Mexico. It became increasingly difficult for Mexican TCOs to deposit their illicit cash proceeds directly into US banks and other financial institutions once the worlds largest banks – HSBC, Wachovia and Citigroup – were hit with billions of dollars in penalties for laundering Mexican cartel money. Mexican TCOs were forced to resort to more complex multi-jurisdictional trade-based money laundering (TBML) schemes that included using cryptocurrencies.
Money laundering using cryptocurrencies
The DEA report pointed out that China has become an important hub for money laundering schemes. TCOs purchase large shipments of “made in China” goods using Bitcoin. These “made in China” goods are then shipped to businessmen in Mexico and South America who reimburse the TCOs in local currency. Bitcoin payments are widely popular in China because it can be used to anonymously transfer value overseas, circumventing China’s capital controls.
US proposes cryptocurrencies amendment to AML laws
On November 28, 2017, when Bitcoin was trading at $9,880, the US Committee on the Judiciary held a hearing on Senate bill S. 1241, titled ‘‘Combating Money Laundering, Terrorist Financing and Counterfeiting Act of 2017.” This bill amends the current US anti-money laundering laws (AML) by making virtual currencies more of a target for regulatory oversight. Prepaid access devices, digital wallets and other digital currency exchangers as being subjected to reporting requirements if they contain the virtual currency equivalent of $10,000 or higher.
According to Judiciary Committee Chairman Sen. Chuck Grassley, S. 1241 is designed to help modernize US AML laws. Grassley explained:
“[S. 1241 will give] law enforcement more tools to prosecute and close legal loopholes. It will clarify rules on evidence for prosecutors and judges, which in turn will help increase convictions. It will make it easier to go after drug kingpins, drug cartels and terrorist organizations by being able to seize virtual currencies more easily.”
EU amends AML transparency laws for cryptotrading
European governments are pushing for global Bitcoin regulation at the G20 level, coordinated by the Organization for Economic Co-operation and Development (OECD). Amid mounting alarm that virtual currencies are being used by multinational money-launderers, drug traffickers and terrorists, the German Finance Ministry explained:
“It makes sense to discuss the speculative risks of virtual currencies and their impact on the financial system at international level.”
Several EU countries will create interconnected registries this year, to record details of the beneficial ownership of inter alia companies and trusts under the EU Fourth Anti- Money Laundering Directive (4AMLD). These central registries of beneficial owners will be made available to local tax authorities and will be shared between tax authorities within the EU (OECD-BEPS Action 12).
On December 20, 2017, when Bitcoin was trading at $17,000, the European Parliament and its executive arm, the European Council, agreed to amend the 4AMLD. This amendment will make virtual currency exchange platforms and wallets subject to the beneficial ownership-reporting requirements (4AMLD Virtual Currency Amendment).
These new regulations will require an increase in transparency by trusts and trading companies, which will be pressured to reveal the holders of virtual currency in order to thwart potential money laundering, tax evasion and terror funding. Primary among these regulations is a requirement to provide beneficial ownership information to authorities and “any persons that can demonstrate a legitimate interest” to access data on the beneficial owners of trusts.
The 4AMLD Virtual Currency Amendment must be formally adopted by EU Member States and turned into national laws within 18 months.
https://kinematec.de/wp-content/uploads/2018/01/725_Ly9jb2ludGVsZWdyYXBoLmNvbS9zdG9yYWdlL3VwbG9hZHMvdmlldy9hMmRlZDExZThjZDFiZjljMTkzMzRlNGJiYjk2YzJkYy5qcGc.jpg483725christianhttps://kinematec.de/wp-content/uploads/2019/10/kinematec_logo.pngchristian2018-01-08 10:35:132018-01-08 10:39:39EU Amends AML Laws for Cryptotrading as US Ponders: Expert Blog | Cointelegraph
The prevailing wisdom for cryptocurrency founders is that you win through hype: talk like an infomercial, parade clownish speakers around conferences, and attack critics relentlessly for “spreading FUD.” That approach works; many aggressive entrants have muscled their way to the top of the charts with these tactics (you know who you are).
But there’s another approach that’s less talked about and just as widely employed, one that cryptocurrency founders and investors need to pay attention to: anti-hype.
Ethereum recently fell from second place to third place in market cap. That was big news, but outlets are covering it wrong. The story isn’t that Ripple beat Ethereum, it’s that Ethereum is playing the anti-hype game. It would be trivial for Ethereum to flex its muscle and rally past Ripple, perhaps even past Bitcoin itself. They power almost every cryptocurrency in the world and their founder, Vitalik Buterin, is the closest thing to a blockchain figurehead. But instead of talking up Ethereum on TV or making blustery statements about how Ethereum will disrupt this or that, Buterin calls token sales overvalued, lambasts bad actors, and makes statements like these:
https://kinematec.de/wp-content/uploads/2019/10/kinematec_logo.png00christianhttps://kinematec.de/wp-content/uploads/2019/10/kinematec_logo.pngchristian2018-01-07 22:31:092018-01-08 10:33:01With cryptocurrency, buy the substance, sell the hype
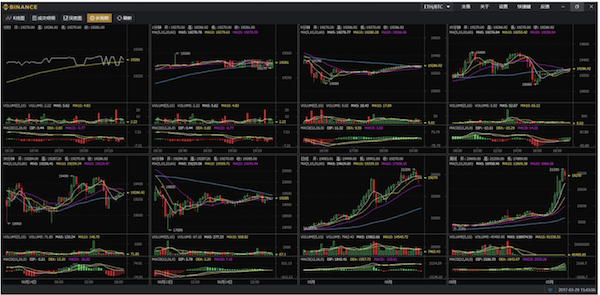
A new exchange has suddenly taken the crypto-space by storm, reaching 3 million users in mere six months since it launched on July 14th 2017 and growing so fast it temporarily does not accept new users at all.
“Servicing existing members is higher priority at this point,” Changpeng Zhao, Binance’s founder, says before further adding:
“Full team working around the clock. Both tech and support. Just too much demand. Added 250,000 new users in the last 24 hours. Just crazy!”
The Hong Kong based exchange held an ICO raising around 30,000 eth, currently worth $30 million, for 100 million BNB ECR20 tokens.
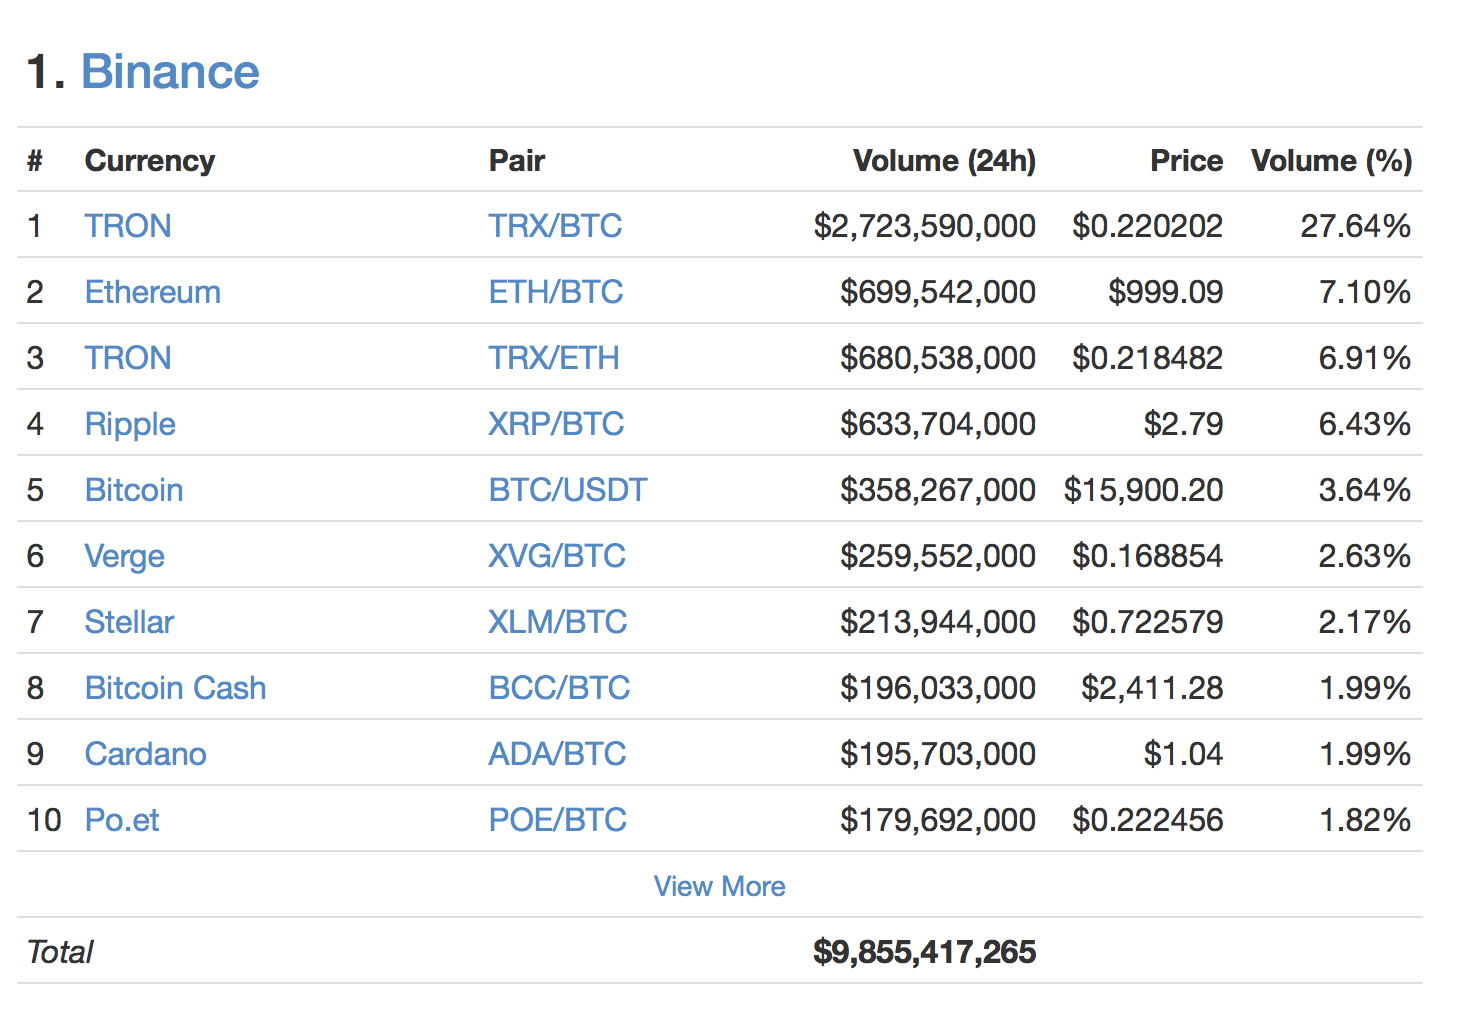
The raised funds are now dwarfed by BNB’s total market cap of some $1.2 billion with Binance’s founders holding half of it, but why did this exchange suddenly rise to top volumes of $10 billion in the past 24 hours, twice that of Bithumb?
The answer might be a number of reasons. First, it is the only exchange to offer Eth pairs, something many have asked for, especially with ever increasing bitcoin fees.
As such, instead of having no option but to buy, say, TRX with BTC, or a number of other coins/tokens, you can now choose whether to buy them with eth or with btc.
That in itself might have led to strong support by the eth community for the exchange and they indeed were the first to mention it in every two sentences.
Secondly, the ICO itself may have created a base of supporters who were monetarily incentivized to recommend the exchange.
With the third reason perhaps being that the team seems decent. Changpeng Zhao is no newcomer to this space. He was the third employee at blockchain.info and a co-founder as well as CTO at OKCoin.
He thus, presumably, knows a thing or two about exchanges. Binance boasts 1.4 million transactions a second, multilingual support, including in Chinese and Spanish, as well as multi-coin support.
It is probably the latter that has given rise to this exchange, proving once again that satisfying market demand can be very rewarding indeed.
Kraken used to be a lingering exchange of no one’s care until they added ethereum back when few had eth trading. Then, it suddenly became a player, until it could not keep up any longer with users given a catalogue of errors instead of a trading interface.
Binance might have perhaps risen in any event, but the market was demanding eth trading pairs, and with it so being the only exchange to provide them, it might perhaps be the primary reason it has so risen.
And with its rise, a new dimension might enter this space. Bitcoin’s only competitive advantage – trading pairs – might no longer be such an advantage as ethereum now enters to compete even in that area.
https://kinematec.de/wp-content/uploads/2019/10/kinematec_logo.png00christianhttps://kinematec.de/wp-content/uploads/2019/10/kinematec_logo.pngchristian2018-01-05 10:42:362018-01-08 10:45:12Binance Adds 250,000 New Users a Day
Wir können Cookies anfordern, die auf Ihrem Gerät eingestellt werden. Wir verwenden Cookies, um uns mitzuteilen, wenn Sie unsere Websites besuchen, wie Sie mit uns interagieren, Ihre Nutzererfahrung verbessern und Ihre Beziehung zu unserer Website anpassen.
Klicken Sie auf die verschiedenen Kategorienüberschriften, um mehr zu erfahren. Sie können auch einige Ihrer Einstellungen ändern. Beachten Sie, dass das Blockieren einiger Arten von Cookies Auswirkungen auf Ihre Erfahrung auf unseren Websites und auf die Dienste haben kann, die wir anbieten können.
Notwendige Website Cookies
Diese Cookies sind unbedingt erforderlich, um Ihnen die auf unserer Webseite verfügbaren Dienste und Funktionen zur Verfügung zu stellen.
Da diese Cookies für die auf unserer Webseite verfügbaren Dienste und Funktionen unbedingt erforderlich sind, hat die Ablehnung Auswirkungen auf die Funktionsweise unserer Webseite. Sie können Cookies jederzeit blockieren oder löschen, indem Sie Ihre Browsereinstellungen ändern und das Blockieren aller Cookies auf dieser Webseite erzwingen. Sie werden jedoch immer aufgefordert, Cookies zu akzeptieren / abzulehnen, wenn Sie unsere Website erneut besuchen.
Wir respektieren es voll und ganz, wenn Sie Cookies ablehnen möchten. Um zu vermeiden, dass Sie immer wieder nach Cookies gefragt werden, erlauben Sie uns bitte, einen Cookie für Ihre Einstellungen zu speichern. Sie können sich jederzeit abmelden oder andere Cookies zulassen, um unsere Dienste vollumfänglich nutzen zu können. Wenn Sie Cookies ablehnen, werden alle gesetzten Cookies auf unserer Domain entfernt.
Wir stellen Ihnen eine Liste der von Ihrem Computer auf unserer Domain gespeicherten Cookies zur Verfügung. Aus Sicherheitsgründen können wie Ihnen keine Cookies anzeigen, die von anderen Domains gespeichert werden. Diese können Sie in den Sicherheitseinstellungen Ihres Browsers einsehen.
Andere externe Dienste
Wir nutzen auch verschiedene externe Dienste wie Google Webfonts, Google Maps und externe Videoanbieter. Da diese Anbieter möglicherweise personenbezogene Daten von Ihnen speichern, können Sie diese hier deaktivieren. Bitte beachten Sie, dass eine Deaktivierung dieser Cookies die Funktionalität und das Aussehen unserer Webseite erheblich beeinträchtigen kann. Die Änderungen werden nach einem Neuladen der Seite wirksam.
Google Webfont Einstellungen:
Google Maps Einstellungen:
Google reCaptcha Einstellungen:
Vimeo und YouTube Einstellungen:
Datenschutzrichtlinie
Sie können unsere Cookies und Datenschutzeinstellungen im Detail in unseren Datenschutzrichtlinie nachlesen.