Cryptoasset prices have been quite turbulent in the past few weeks. At times like this it’s especially important to look at the fundamental foundations of cryptoasset prices, and quantitative metrics. Today I will share with you one of the main metrics we use in our investing decisions at Cryptolab Capital.
Emerging field of cryptoeconomic ratio analysis
In traditional finance, ratio analysis is one of the most widely used valuation methods. Lacking the detail of other valuation approaches, such as DCF analysis, ratio-based valuation is much faster and is still a good proxy of fair value. It also allows one to easily track asset price dynamic over long periods of time as well as compare different assets to each other.
Over the course of the last year, a new study of cryptoeconomic ratio analysis emerged. The main idea behind this new field is to study the relationship between price of a cryptoasset and its fundamentals. One of the most widely known ratios is Network Value to Transactions, or NVT. Introduced and popularized by Chris Burniske, Willy Woo, and the team behind Coinmetrics, NVT is often called “crypto PE ratio.” Here’s the definition of the ratio:
In a traditional PE ratio, the earnings metric in the denominator is used as a proxy for the underlying utility of the company created for the shareholders. While cryptoassets don’t have earnings, one can argue that the total value of transactions flowing through the network is a proxy for how much utility users derive from the chain. It is worth highlighting that Daily Transaction Volume in NVT takes into account only on-chain transactions. All the trading activity that happens on exchanges and is, for the most part, speculative is not included in this volume.
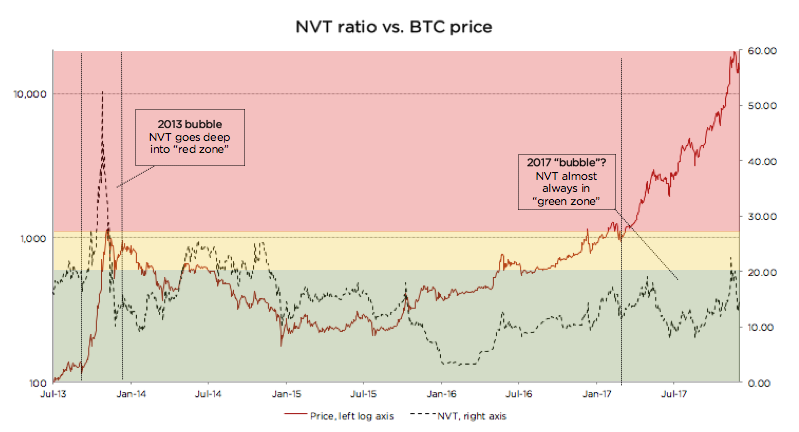
This Forbes article argues that NVT can be successfully used to detect bitcoin price bubbles when valuation is not supported by fundamentals and differentiate them from consolidations. The chart below concisely illustrates this argument.
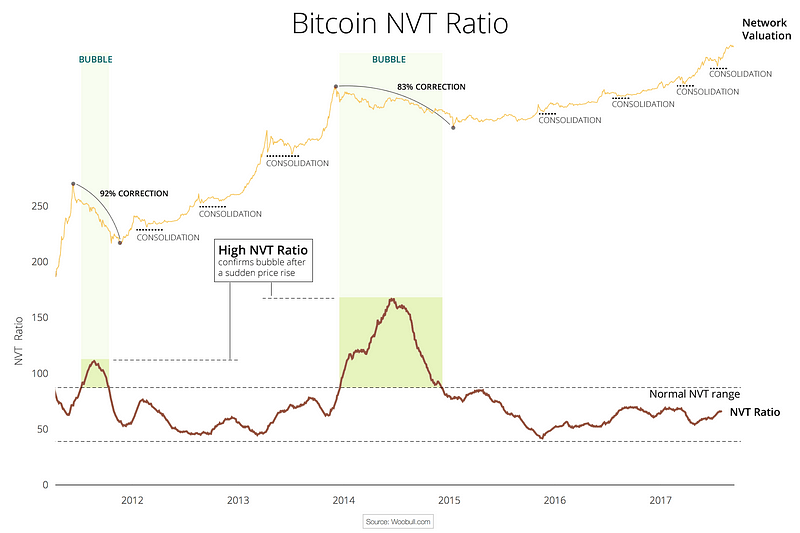
This chart also greatly illustrates what we at Cryptolab Capital don’t like about NVT in its current form. The spike in NVT follows the bubble with a considerable lag of a few months. Peak NVT coincides with the middle of a correction period. NVT is neither predictive (doesn’t precede the overvaluation), nor descriptive (doesn’t coincide with it). You can only detect the bubble a few months after it bursts.
Rethinking NVT ratio
Trying to dissect this issue and improve this ratio, we started by looking at the ratio definition:
“Ratio has been smoothed using moving averages, 14 day forward and 14 day backward facing…”
Mathematically speaking, this means the following:
Hereinafter:
- NVT_Classic stands for “Classic definition of NVT”
- 28 MA is “28-day Moving Average”
- NV is “Network Value in USD”
- TV is “Transaction Volume in USD”
Let’s pause here and look back at the conceptual meaning of NVT. In this ratio, Transaction Volume is used as a proxy for fundamental network utility value. When you look at Transaction Volume on a daily basis, there is a lot of noise, so I completely agree with the decision to smooth it by using a 28-day Moving Average. But we asked ourselves a few questions:
- Why 28 days, and not 10, 30, 90, or 180? A 28-day average might be not enough for a truly fundamental metric.
- Why 14 days forward and backward? If we are trying to develop a predictive, or at least descriptive, indicator we shouldn’t rely on future data.
- Do we need to smooth both parameters — ratio as a whole — or just the denominator?
We then experimented with different Moving Average periods, and came to an empiric conclusion that the optimal solution is to divide daily Network Value by 90 days Moving Average of Transaction Volume. So here’s a definition of our new NVT ratio:
Comparing old and new NVT for bitcoin
As can be seen from the chart above, when we move from a 28-day Moving Average to a 90-day Moving Average NVT definition, we get rid of the time lag issue described above. We can also see that every time NVT went to the Yellow or Red zone (autumn 2013, spring 2014, December 2017), a price correction followed.
We claim that this refined NVT ratio is a better descriptive metric of bitcoin bubbles. Conceptually, this makes sense. Given that Transaction Volume in NVT is a proxy for fundamental utility value of the network, a 90-day Moving Average is a better proxy for long-term fundamental value than a 28-day Moving Average.
Let’s now look at the recent bitcoin price performance using the refined NVT ratio in more detail. From January until mid-December 2017, bitcoin has appreciated almost 20x. For the most part of this rally, though, NVT ratio has stayed in the Green Zone. However, in December when price reached almost $20,000, NVT went into the Yellow for a few days. This rapid appreciation was shortly followed by a 30% price correction, and another even steeper price correction in the last weeks. After the correction, NVT has returned to the Green zone. This is another empiric evidence in support of 90 MA NVT.
Looking at the chart below, it is much harder (if at all possible) to foresee the December 2017 correction. Quite the opposite, during late 2017 price rally, NVT went down! How can it be?
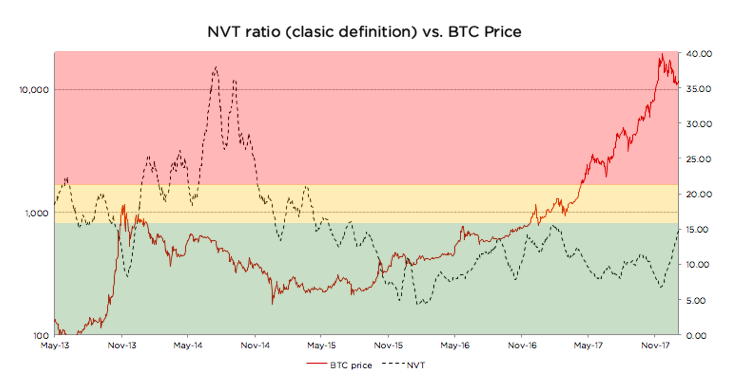
There is a non-static non-linear relationship between the numerator and denominator of NVT. Every time there’s a sharp increase in price, there’s growth in trading activity (off-chain transactions) that is shortly followed by on-chain transaction volume growth as investors liquidate their positions. Exchanges and wallets trade with each other to provide liquidity to their users. All this activity increases on-chain transaction volume, even though it is fully speculative.
In other words, the cryptoassets exhibit reflexivity. In the short run, the price changes the fundamentals. In this case, transaction volume follows price. I don’t want to go into much detail on this, but I can refer you to an excellent article on the topic by the Coinmetrics team: “Mean-reversion and reflexivity: a Litecoin case study”.
So why does a longer period average result in a better indicator? Intuitively it makes sense. By definition, the role of Transaction Volume in the NVT denominator is to be a proxy for fundamental utility that users get from using the network. A longer smoothing period helps to get rid of the reflexivity effects described above — spikes in transaction volume that follow sharp price increase. These irregularities are speculation-driven and are bad descriptors of fundamental intrinsic utility of the network. When we remove these irregularities, we end up with a better proxy for fundamental value in NVT denominator, and, as a result, the new NVT ratio becomes a better descriptor of price level.
Analyzing Litecoin using the refined NVT
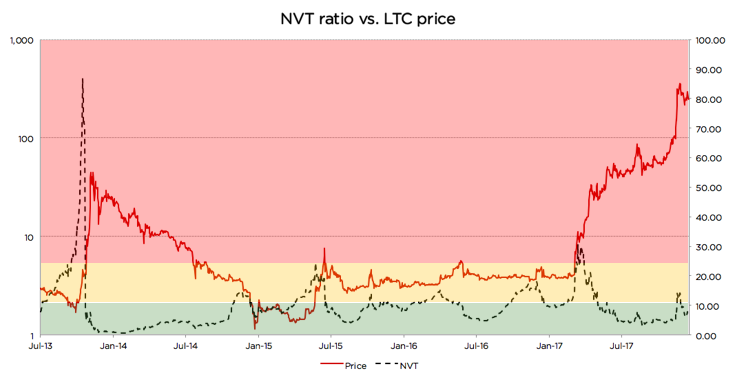
Looking at the chart, we can see that there were at least 3 cases since 2013 when the same logic applied: price spikes coincided with, or in some cases were even preceded by, spikes in 90-day NVT
- Autumn 2013
- Summer 2015
- Autumn 2015
- Late 2017
However, in a few cases it didn’t work as well. Those cases are usually explained by a strong trend or some big external news:
- In late 2014, an NVT spike happened during a one-year-long price correction, and the price just kept going down. A similar dynamic can be seen on the BTC graph above during the correction of the second half of 2014. NVT spiked a couple of times while BTC price was steadily declining.
- Most interestingly, in April 2017 NVT spiked really high, but price actually went up! Here there were a couple of strong external factors: (1) SegWit adoption speculation, and more importantly, (2) listing on Coinbase in May that propelled asset price to a whole new level and moved LTC to another league. The price did increase significantly, but the fundamentals shortly followed.
Despite these exceptions, the descriptive power of the refined NVT for detection of overvaluation is still quite strong. It is definitely stronger than that of the currently used NVT.
Using new NVT for BCash
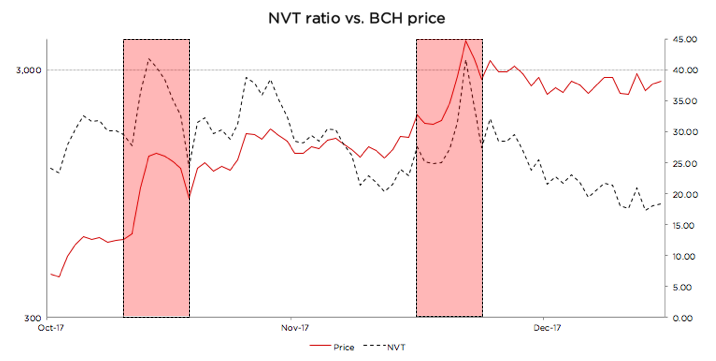
BCash is quite new, and its history has been full of breaking news, hostile attacks on bitcoin, and other exogenous events. Given this, it is hard for us to define the limits of the Green, Yellow, and Red zones for this currency. If we were forced to state Cryptolab Capital’s opinion, we would likely say it is rather overvalued at the moment, the NVT might still be in the Red zone, and the fundamentals have to catch up for the price to make sense.
But one thing that can be seen from the chart above is the sharp NVT spikes coincide perfectly with local price maxima. Yet another win for redefined NVT.
Summary
For every investor it is of crucial importance to understand what is going on in the market right now. As a result of Cryptolab Capital research, we have designed a metric that describes price bubbles well and without a time lag across different time periods and assets.
There is, however, another more fundamental weakness of NVT. It only takes into account total value of on-chain transactions, but it doesn’t factor in the number of transactions or the number of addresses (wallets) participating in these transactions. Let’s call this metric Daily Active Addresses (DAA).
For internet companies, especially marketplaces, social networks, and other businesses with strong network effects, the analogous Daily Active Users (DAU) indicator is one of the most important performance and valuation metrics. This and other metrics that now make up the language of valuing internet companies didn’t exist in the 1990s. It has been developed by technology investors over the last 20+ years. Similar valuation framework for cryptoassets is yet to be developed and is only starting to form.
In our next post, we will try to contribute to this framework and propose a way to use Daily Active Addresses (DAA) in cryptoasset network valuation.
Acknowledgements
I wanted to thank a few people who contributed to my understanding of cryptoasset investing, and gave valuable feedback in the process of this research:
- Professor Susan Athey from Stanford
- Professor Christian Catalini at MIT
- Chris Burniske from Placeholder.vc
- Willy Woo
Source: https://medium.com/cryptolab/https-medium-com-kalichkin-rethinking-nvt-ratio-2cf810df0ab0